Friday, July 29, 2022

Week 10: Sensitive Feature in RCoT

 1 Sensitive Feature in RCoT

The need for adding a parameter sensitive into RCoT algorithm is that, for data from reality, the variables always shows some degree of dependence, while the original RCoT algorithm is too sensitive to provide useful information, since it will regard all relations between variables as dependence.

Since the original result p-value goes to 0 when it detects dependence, which makes it impossible to modify it simply by adjusting the threshold, we would need to find another value to make the decision. The new value we use is Sta inside the RCoT algorithm, which is the number of samples multiplies the norm of covariance matrix of two variables.

1.1 Sta Property


Since we need a value which is unrelated with the sample sizes and the number of features, we need to adjust for original Sta to stabilize it on any situations, so that it can represents the degree of dependence between variables. Through experiments, we currently use Sta/(number_of_features**2), which is stable for different number of samples and features. It turns out it is still relevant with the number of conditions, where more conditions will result in smaller value.

Frankly speaking, using Sta does not have theoretical support, the whole purpose of it is to decrease the sensitivity of the original RCoT algorithm.

1.2 Implementation


Aside from calculate the new value Sta, we also need to adjust the output for it with new parameter sensitivity. The sensitivity decides the threshold for Sta about whether two variables are dependent. We also use tanh to translate the results into range [0, 1].


2 Conditional Expectation with ML


2.1 Implementation


Since the random forest shows best performance,  we now use it as our ML method to calculate expectation. For implementation, we also use parameter power to determine the number of trees of the forest. Larger power corresponds to more trees, which is consistent with the fact about power that larger power will have longer running time while provides more accurate results.

When test on it, some interesting fact shows that when conditioning on one variable, random forest's performance is poor compare with probability method, while conditioning on more than one variables, the performance gets better and shows large improvement over probability method. When conditioning on only one variable, we may need to use other ML methods or use D or J-Prob.

3 Plan for Next Week


  • Merge the implementation into Because module
  • Prepare for presentation and poster

Friday, July 22, 2022

Week 9: Experiment on Conditional Expectation with ML

 1 Conditional Expectation with ML


This week I mainly focused on doing experiments on conditional expectation with ML. The purpose of the experiments is to compare the performance between ML method and original implemented method (Discrete, J and U method, which utilizing RKHS), and between different ML algorithms.

1.1 Correctness of implementation


The first experiment was to test the correctness of the implementation, to see whether it can calculate expectation correctly.

The data model used and the experiments results are shown below:


The program are testing the ACE of IVA on IVC, which should be -3. We can see from the results that ML method can calculate correctly with the best accuracy.

1.2 Performance when increasing dimensions


The hardest part for calculating conditional expectation is that when dimensions go large, the dimensional curse occurs due to the sparsity of data. With high dimensions, the traditional discrete way to calculate expectation becomes infeasible since there are not enough data to give an accuracy estimation.

The experiments at this time try to show how the performance changes due to the increasing of the dimensions. The results are shown below:


Here we used Kernel Ridge Regression with Random Fourier Feature as our machine learning method. From the results above, we can observe that the average R2 (indicating how much the method has explained for total variance) decreases rapidly as the dimensions goes high. When running on 6 dimensions conditional, machine learning method seems to be unable to give a correct results, while J-prob method still shows good capability even with only 1000 samples.

1.3 Experiment with different ML algorithm


Since there are lots of ML methods for regression task, which has different properties, it is better to test all of them to say whether they have similar results regarding this task. The experiments results are shown below:


It turns out that different ML methods vary a lot in performance. K-Nearest Neighbor, SVM, Random Forest and Neural Network all show a better performance than J-Prob method. Especially for Random Forest, it outperforms other methods significantly with both 1000 or 10000 samples with very good runtimes.

Therefore, more experiments are done for RF algorithm to test out the best hyperparameter: the number of trees. The results are shown below:


From the experiments we can observe that the increasing of trees always shows a positive influence on the performance, while the price would be the increasing of runtimes.

2 Plan for Next Week


  • Extend the conditional expectation with ML to discrete cases.

Friday, July 15, 2022

Week 8: Finish Direct LiNGAM and Start on Conditional Expectation with ML

 1 Direct LiNGAM


Last week we tried to unveil what behind Direct LiNGAM non-linear algorithm, and figured out what exactly happened for different cases. In this week, I tried to solve the last problem: What if the actual causal relation for x to y is y=f(x+e())? What will happen if we apply our algorithm on this structure? And can we detect this structure?

From the discussion last week, we know that this causal relation can be rewrite as x=f^(-1)(y)-e(). Since the mean of the noise e() is 0, this structure is exactly what we assume correct for causal relation. When I run algorithm on such cases, I would expect that the algorithm will give a reverse direction. However, in experiments, for both directions, the residual and variables are always detected dependently. Since the RCoT algorithm always gives 0 for dependency relationship, we need to find out a new method to evaluate the degree of dependency to determine the direction.

The value Sta we use is a intermediate value inside RCoT function, which is the sum of square of all value in the covariance matrix for Fourier Feature. A larger value would indicate a more strong dependency intuitively.

1.1 Function with no inverse function


It is still possible that the function doesn't have an inverse function. In this case, for both sides of the test, the residual will show strong dependency for both p-value and Sta would be similar and there is no way to determine the direction if only considering the dependency.

1.2 Function with inverse function


When running algorithm on functions with inverse function, like tanh or cubic function, the results turn out to fit our expectation. As we mentioned before that the p-value for both direction would all be close to 0, indicating that for both direction the residual show dependency with variable, which makes it hard to compare. However, when we use Sta to compare the degree of dependency,  we could see that in the backward direction there is less dependence, which fits our expectation that the algorithm will tend to give reverse results.

Since the algorithm for such case just gives out a totally reversed results, there is just no way that I can think of to distinguish between them.

1.3 Merge Request


The pull request for updating RCoT and integrating Direct LiNGAM non-linear has been merged into the Because module main branch.

2 Conditional Expectation with ML


This week I begin to work on this new topic.

By the end of this week, I have implemented the algorithm and run the simple test correctly.


The implementation basically follows other conditional expectation method, while replace the calculation of expectation into the machine learning prediction, and save the model in cache to reuse further.

Some little confusion about implementation arose and can be discussed in the meeting next week.

3 Plan for Next Week

  • Discuss and optimize the current implementation
  • Design test program to test the performance of conditional expectation.

Friday, July 8, 2022

Week 7: Insight into Direct LiNGAM Conjecture

 1 Direct LiNGAM Conjecture


In this week and last week, I spent some time digging into the exact non-linear cases for the direct test. More specifically, I visualized the fitting line and points to see how non-linear models work, and the relation between residual and variables to see whether the results fit our assumption.

After digging into the tests, I believe it is time to rethink on the conjecture and give a better illustration.

1.1 Basic Assumption


The basic assumption for Direct LiNGAM Conjecture is that it makes causal direction equivalent with the formula y = f(x) + e(), where f() can be any functions, and e() is a noise with mean 0 (if the mean is not 0, we can put the mean into f() and still get a mean 0 noise). In this case, if we detect a structure like this formula, then we will assume that y is caused by x.

We could notice that if the real causal effect does not satisfy our assumption, then the direct test could be totally wrong. For example, if the noise is relevant with x, or the noise is inside of the function f(), then we can not determine the causal direction correctly, since it is against our assumption.

1.2 Direct Detection


Now the question becomes how to detect such structure. We can notice that for the forward direction (the real causal direction), if we remove the influence of x from y, then the residual, which is the noise, is independent with x. Then in practice, we could fit y with x using a non-linear machine learning model, then run a independence test on the residual and x. If the residual is independent with x, then we could say that we discover a y = f(x) + e() structure.

Notice that we have a high demand on the non-linear machine learning model here, since we need it to remove all the influence of x on y. If the model can not fit the function f() well, then the residual will be dependent on x. Since there are a lot of choices for non-linear model, the through tests would be needed, which is done previously and viewed in visualization.

We could also think what will happen if the real causal doesn't fit out assumption. If the causal is like y = f(x) + e(x), where the variance of noise e() is dependent on x, then in our test, the noise will be dependent with x, and the correct direction can not be detected. If the causal is like y = f(x+e()), the residual we get will also be dependent on x. For example, if y = (x+e())^2 = x^2 + 2x*e()+e()^2, the residual we get will be 2x*e()+e()^2-E[e()^2], which is dependent on x. What's more, if we examine the backward direction, where x = f^(-1)(y)-e(). Then if the inverse function exists, like in this square case, the algorithm will detect that this backward direction is the correct causal direction.

Another question remained is that what if we run the direct test on the reverse direction if the causal effect satisfies our assumption. In fact it is the reverse case we discussed above, that x = f^(-1)(y-e()). The residual we get for this will be dependent on y (I am not quite sure about whether there exists a non-linear function where the residual will be independent with y, here different non-linear function and different kind of noise will have different results). If the relation is linear, then the noise can not be all from normal distribution, which has been proved previously, otherwise for both directions the independence will be detected.

Although in assumption we can detect such structure easily, in practice it may not be that easy since we don't have infinite dataset, and our non-linear model can not always fit the function well. And for some functions, it is just impossible to fit. Therefore, in practice we will run the direct test on both direction and compare the degree of independence. If the margin between two directions are large enough we will decide that the direction with more degree of independence to be the causal direction.

1.3 Non-linear Function Category


When visualization on the direct test results, it turns out that there are multiple cases of non-linear function, which have different results of the algorithm.

1.3.1 Non-monotonic Function

If the function f() here is non-monotonic, then there will be no inverse function, and the reverse direction will test out highly dependence. As long as we can fit the function well, the results would be correct.

For example, we can visualize on square function, the results would be very clear.


Forward direction fitting line and residual


Backward direction fitting line and residual

1.3.2 Function Cannot Be Fitted

Some functions are just simply can not be fitted by a non-linear machine learning model, and for that causal direction, the residual will be dependent and the causal direct can not be detected.

For example, consider function y = 1 / x. If x comes from a noise with mean 0, the function just can not be fitted due to the extreme value.


Forward direction fitting line and residual

1.3.3 Function with 0 derivative in the limit

These functions are like the reverse version of hard-to-fit functions, where the inverse function of them is very hard to fit.

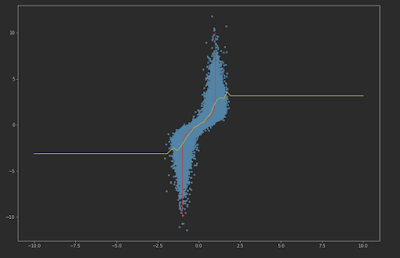
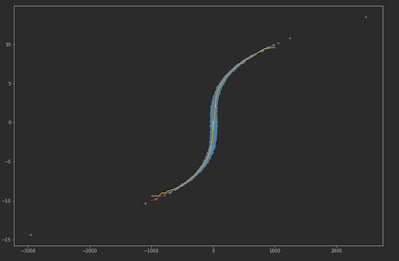
For example, we can consider the function y = tanh(x), where the derivative goes to 0 when x goes to infinite. The forward direction would be easy to detect. The backward direction would result in dependent results, though may not like what we expected that the residuals are dependent, but that we just simply can not fit the model.


Forward direction fitting line and residual


Backward direction fitting line and residual

1.3.4 Function Can Be Fitted

In the end we can examine the cases that the function can be fitted well by the non-linear model for both directions.

We can take y = x^3 as our example. We can observe that the residual in backward direction shows strong dependence on y, as we expected.


Forward direction fitting line and residual


Backward direction fitting line and residual

1.4 Integrating into Because

I rewrite the test_direction function in Probability Module and add self.power into cGraph class to support choice of direction test method. When using power>1, function would use non-linear model to fit, otherwise it would use LiNGAM tanh variant method.

For every test, the non-linear algorithm would run direction test for both directions and calculate the margin. If the margin is large enough, then we could decide that this direction is the correct causal direction. In order to output the results in consistency for both methods, the algorithm would scale the margin, then both methods would use 0.0001 as threshold.

Currently the non-linear method uses KNN (k-nearest neighbor) as non-linear model, and uses at the most 100000 samples to fit.

I also remove the standardize process in the algorithm, since I find that it has just input standardized data at the beginning. After test, it should accelerate about 10% of running time.

2 Plan for Next Week

  • Begin working on conditional expectation with machine learning


Friday, July 1, 2022

Week 6: Direct LiNGAM

 Direct LiNGAM


Experiments on more non-linear models


More experiments done on non-linear models. The model of the data and the summary of the experiments are shown below:


We can draw conclusions from the results above:
  • About correctness, all non-linear models show consistency. They all can not distinguish the direction on causal relation: (N, N3), with extreme value and hard to fit; (M, M4), the noise is related with the causal and can not detect independence; (M, M6), (M, M7), a reverse version of formula, the noise is on the other side of the direction, making the algorithm to draw the opposite conclusion; (IVB, IVA), normal noise which can not be distinguished by LiNGAM.
  • The margin varies between models, Gaussian Process Regress has a better margin and good running time. Meanwhile, Kernel Ridge Regression with Random Fourier Feature are fastest, making it possible to applying on larger datasets. In such condition, KRR shows a best performance.
Experiments are also done to test the ability about noise with different variance. The model of data and the summary of experiments are shown below:


We can observe that:
  • The correctness varies between models. However, in actual experiments, a lot of tests get margin around 0.05, which is exactly the threshold I set to determine the correctness. Therefore, it is very hard to say that the high correctness means the high accuracy, different runs may turn in different results, even if I run it 100 times every time.
  • Using more data has significant improvement on the performance. Therefore, KRR with RFF has a lot advantage since it is a non-linear regression method and runs very fast.

Direct LiNGAM Conjecture


I made a jupyter notebook to visualize the results of the experiments above to look deeply into the Direct LiNGAM Conjecture. Since it is much more straightforward to see it using jupyter, I will leave a link to the notebook here instead.

Bug Fix


I fixed a bug when try to use RCoT on conditional dependence test. Before that, I didn't implement the conditional dependence test with RCoT. Since now RCoT becomes default method, this must be implemented.

I also fixed a bug about lpb4 algorithm. There is a chance that when running on very extreme condition, the lpb4 algorithm may occur a ValueError (The exact reason is inside the algorithm, which I am not familiar with). Now the algorithm will use hbe algorithm instead when that error occurs.

Plan for Next Week

  • Presenting on Direct LiNGAM Conjecture and discuss it.
  • Working on conditional expectation with ML.

Week 10: Sensitive Feature in RCoT

 1 Sensitive Feature in RCoT The need for adding a parameter sensitive into RCoT algorithm is that, for data from reality, the variables alw...